Electrical Resistivity of the Elements
This Table is a collection of the electrical resistivity values for the elements extracted from the sources listed below:
Sources
The following is a list of the documentation sources from which the above data has been selected.
HME: Handbook of Metal Etchants; Perrin Walker, William H. Tarn; CRC Press
MSHME: Mark's Standard Handbook for Mechanical Engineers; Theodore Baumeister; McGraw Hill
JPCR: Journal of Physical and Chemical Reference Data; Donald R. Burgess, Jr. & Allan H. Harvey; AIP Publishing
NIST: National Institute of Standards & Technology; US Department of Commerce
SMRB: Smithell's Metals Reference Book; E A Brandes & G A Brook; Elsevier
CRC: CRC Materials Science and Engineering Handbook;
W: Wikipedia.org;
MW: MatWeb.com;
CC: Chemicalaid.com;
comments: CalQlata believes (rightly or wrongly) data provided in 'published books' may be more reliable than website sources, simply because, CalQlata also believes that greater care is taken over data verification.
Caution
The empirical measurements provided in the above Table have been taken from numerous sources, all of which are claimed to be as a result of laboratory measurements, which are of course, subject to experimental error, such as;
1) Measurements taken using equipment that is not manufactured from the subject material.
2) Experiments not usually taken on a pure crystal of the subject material.
3) Experiments not necessarily carried out in an oxygen-free atmosphere; e.g. no consideration is given to the immediate oxidisation of the subject material (such as potassium, sodium, rubidium and lithium).
4) Most documented values vary with all other documented values except - such as those on internet sites - where such values are simply copied without verification.
5) Documented values such as 1E+07 μΩ.m, 2E+12 μΩ.m & 2E+21 μΩ.m, 10⁵ μΩ.m, 1.8E+16 μΩ.m, etc. are at best questionable.
6) Values for carbon, for example, are not always specified according to form; diamond, graphite, coke, etc.
7) The resistivity of metals such as mercury that have been measured @ 300K in liquid form, meaning that its volumetric state will have given unrepresentative values. The one solid value must have been carried out at less than 273K, and therefore incomparable.
8) The rare earth elements are of particular concern due to; a) the limited work performed on pure crystals of these elements due to the expense, and b) their variability.
For Example
Comparison Plot
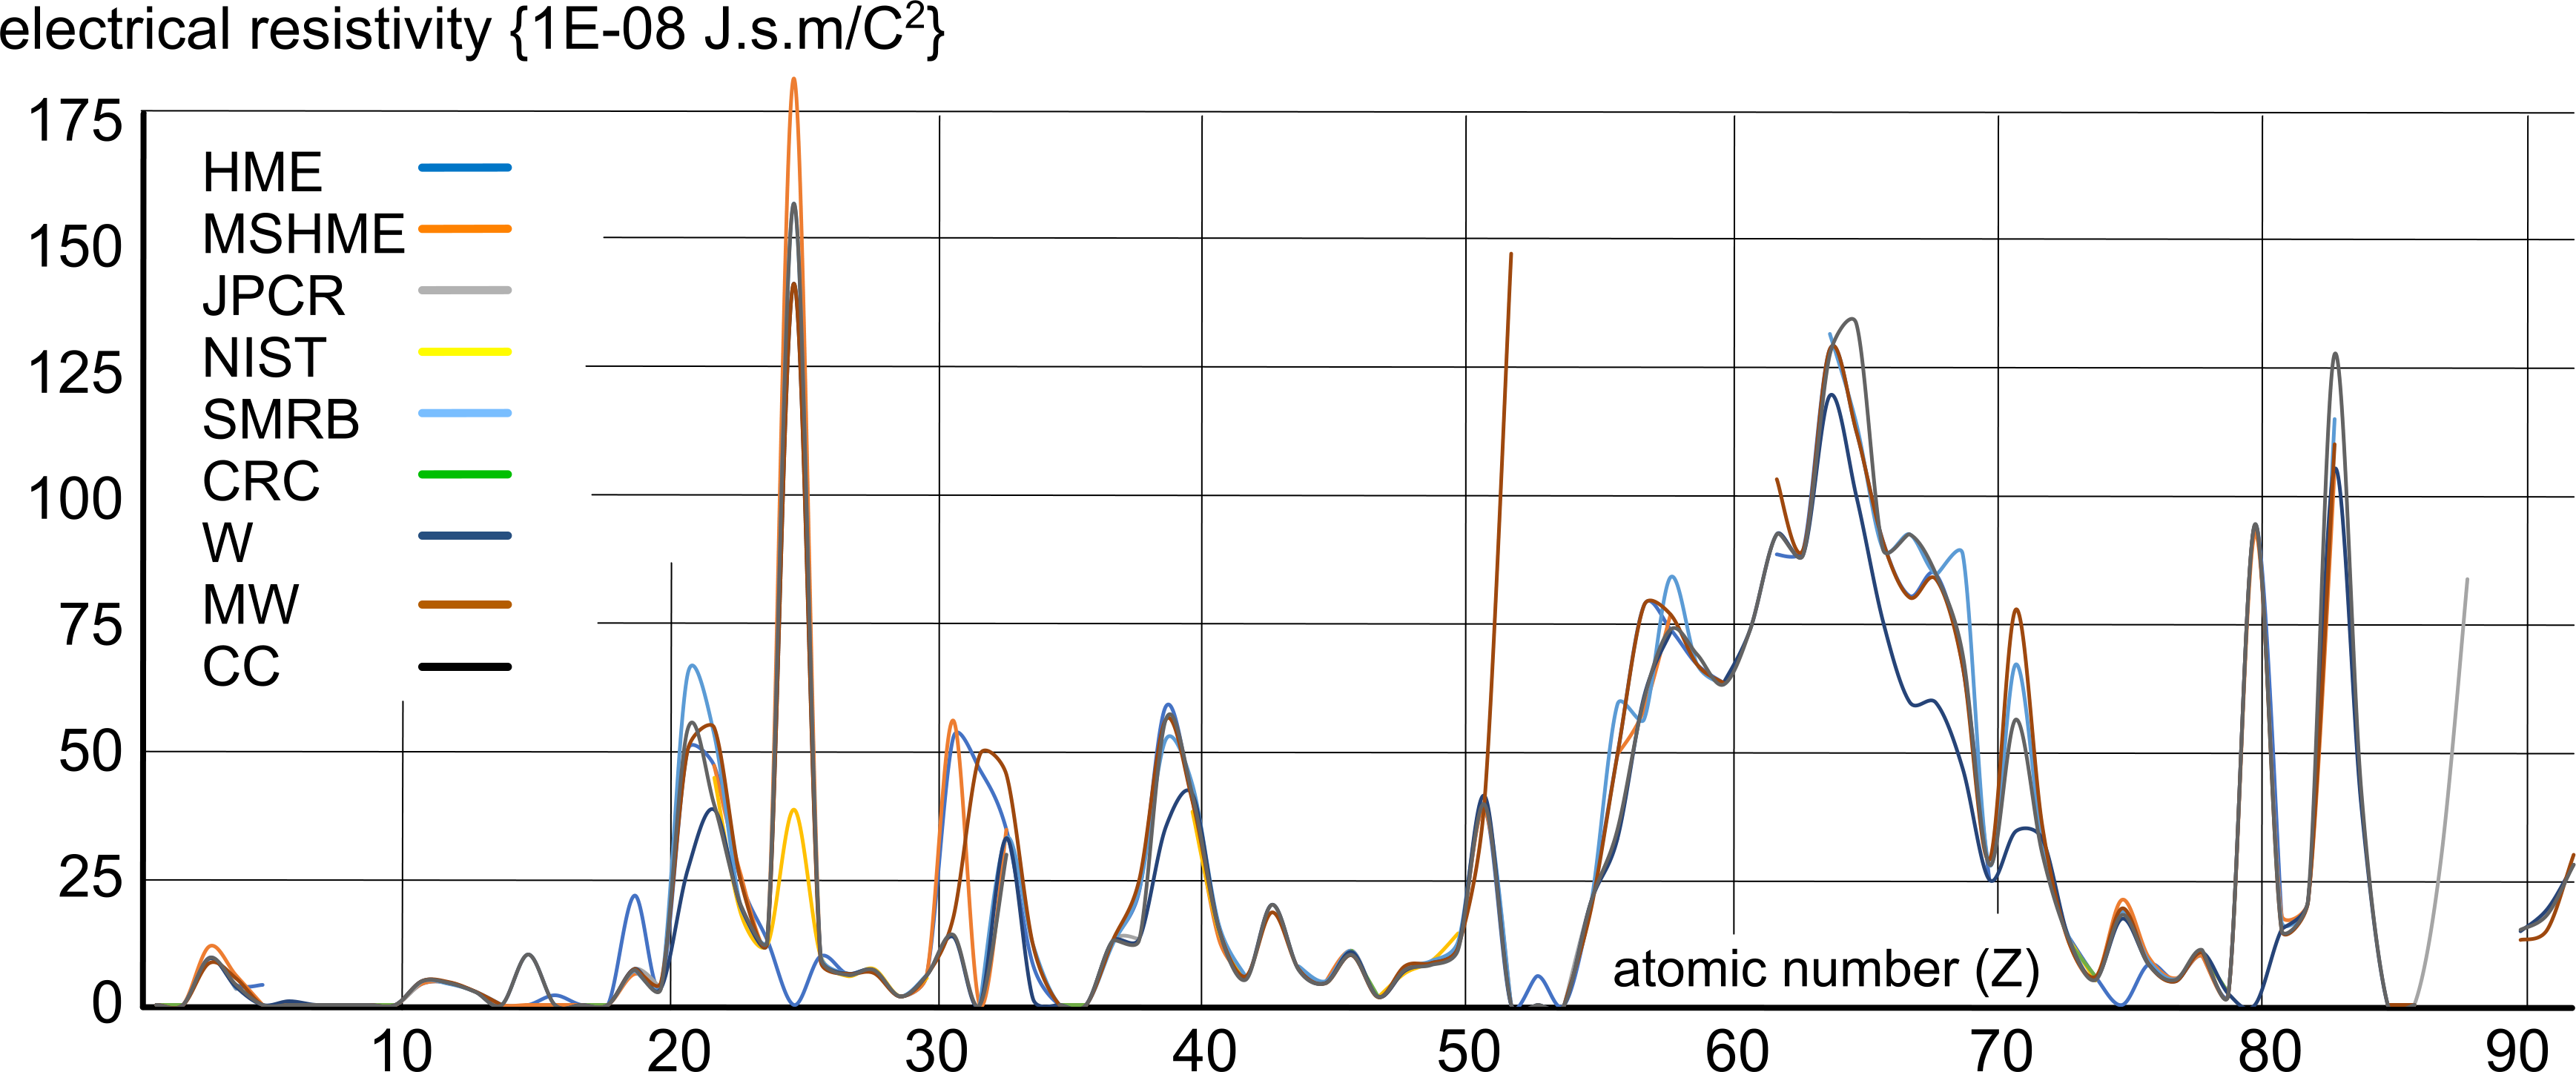
Fig 1 is a comparison between all the above resistivity values; obviously unreliable values have been ignored.
In other words, this series of plots reveals an expected pattern, not definitive values. For example, the rare earths (57 to 71) appear to be generally higher than the other elements, but we have no idea why; it could be due to the cost and rarity of such elemental matter resulting in lower purity of the test samples. And manganese (25) is also unexpectedly high, which may or may not also be due to test sample purity.

Copper
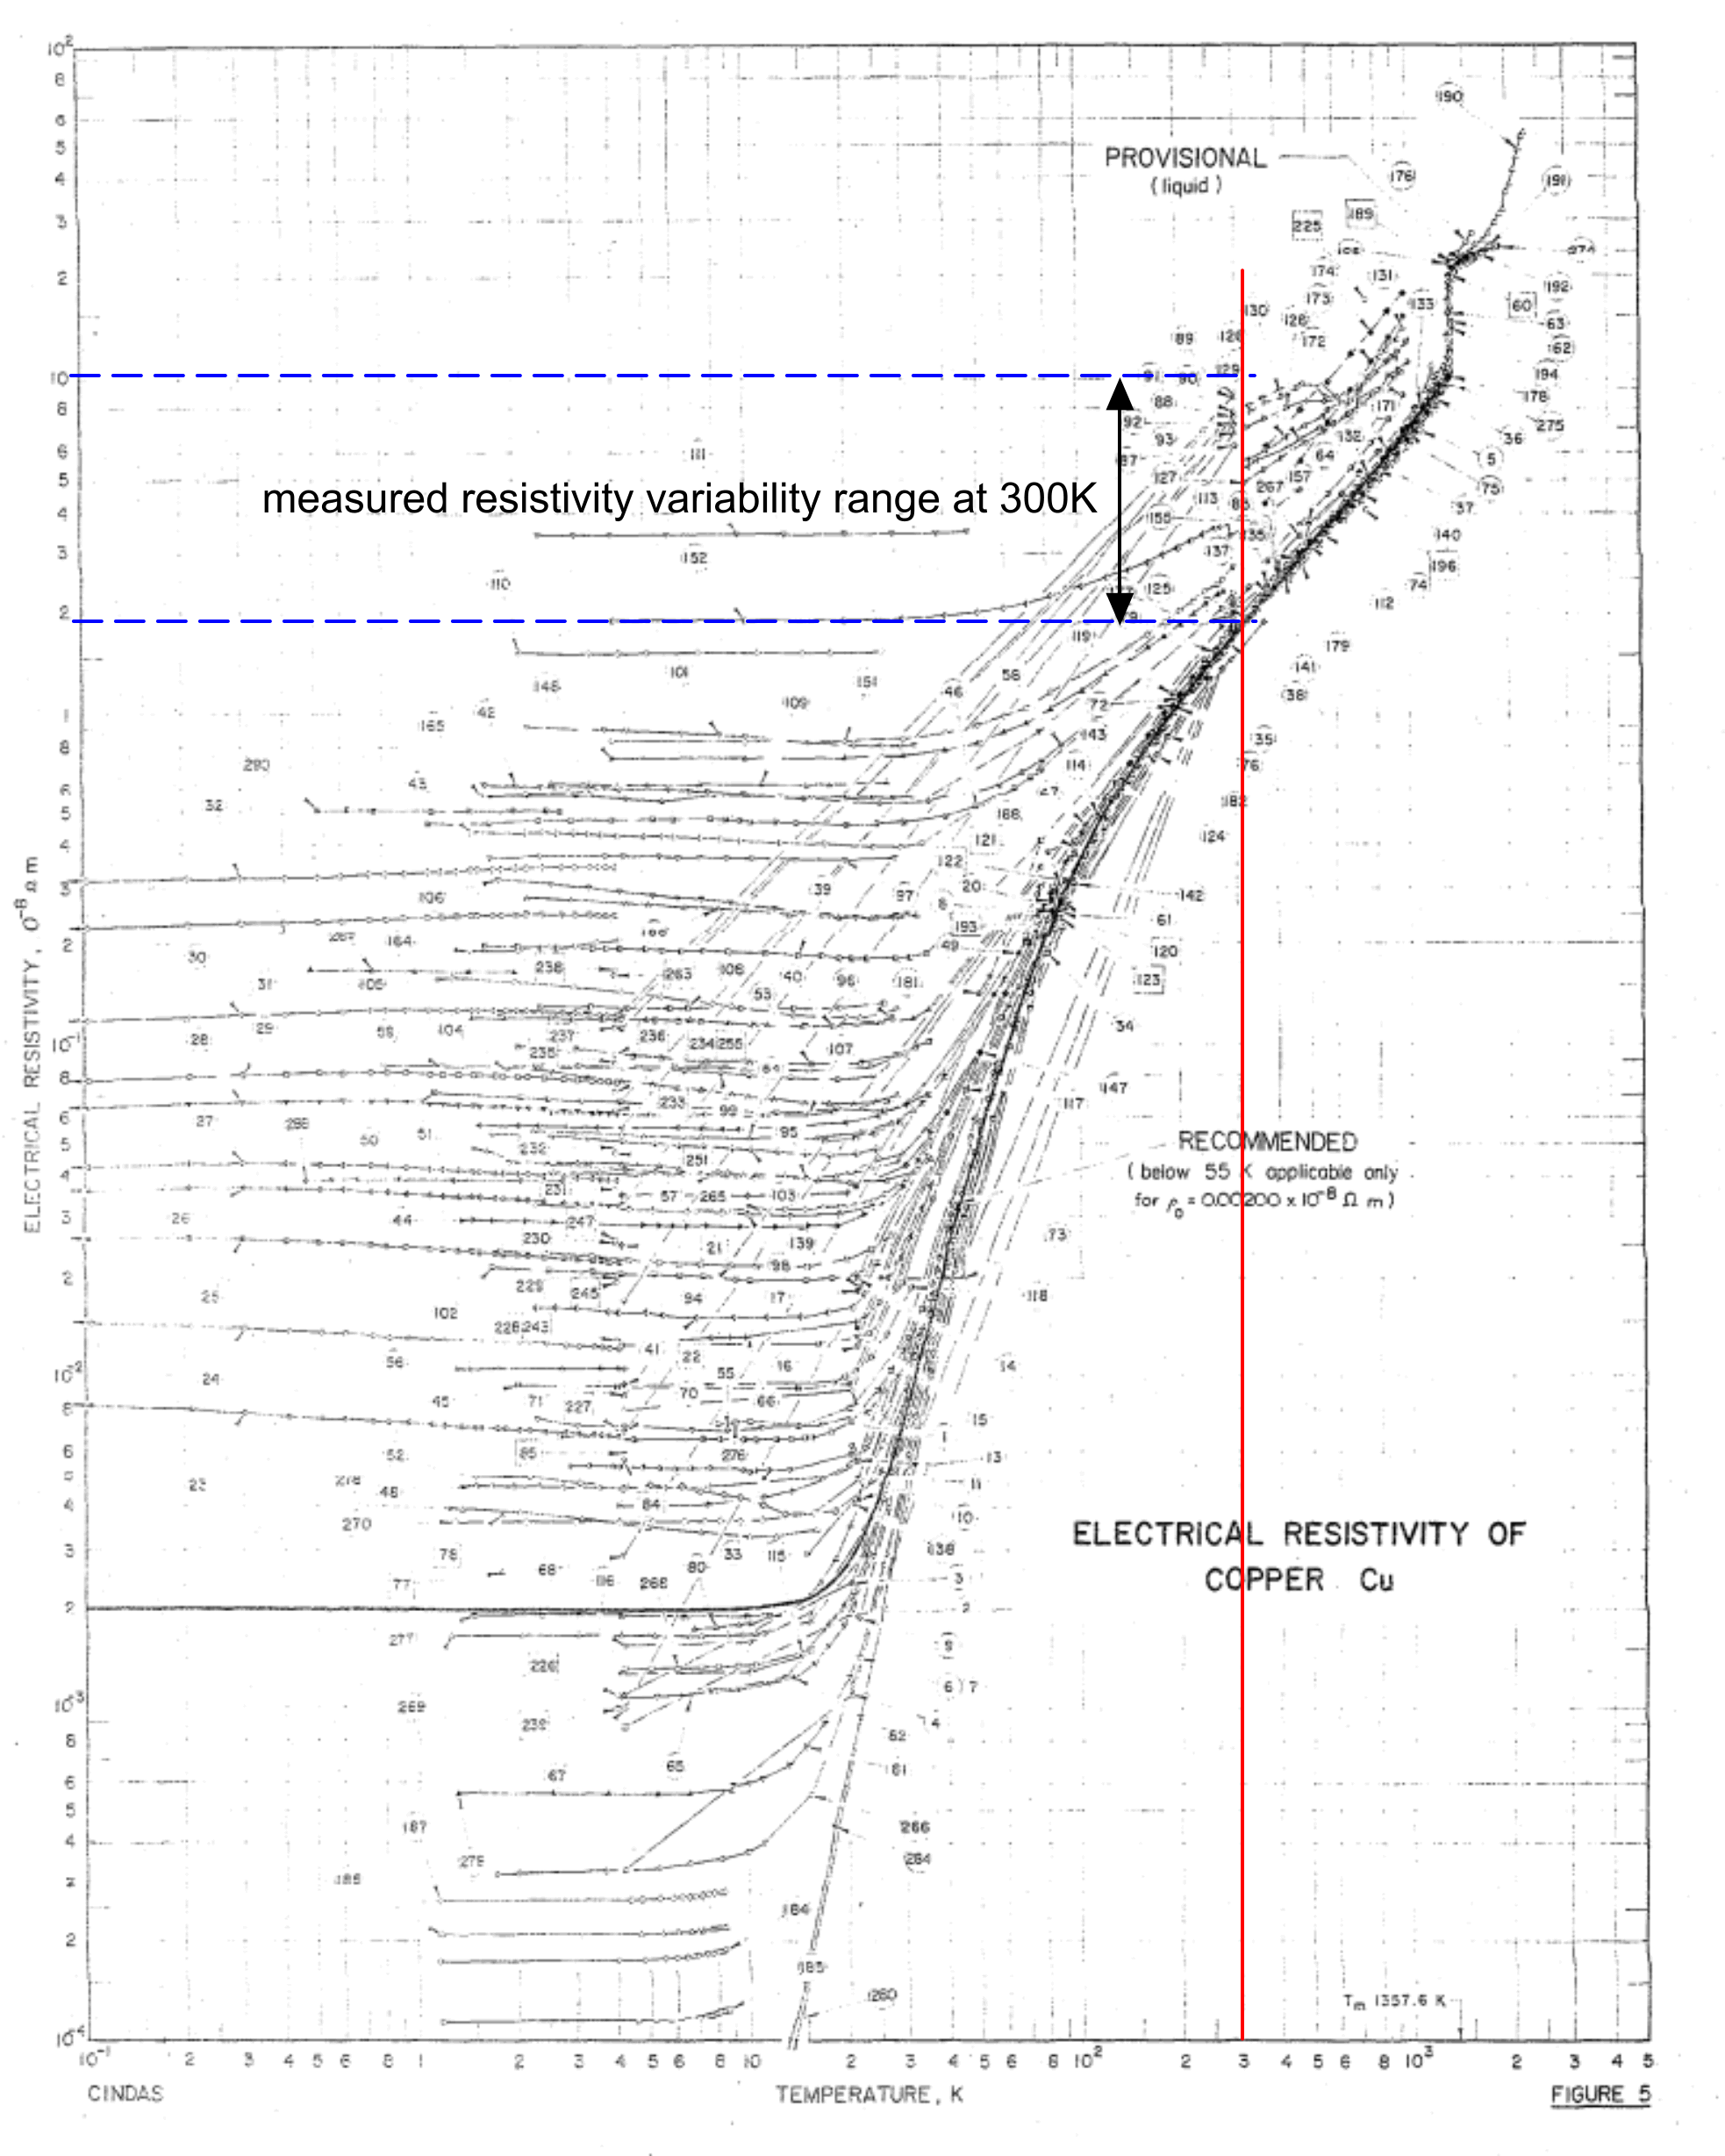
As can be seen in Fig 2, even the most dedicated and capable experimentation⁽³⁾ is subject to significant variation;
1.8 < ρ < 9 (10⁻⁸ Ω.m) (δρ = 5.4E-08Ω.m ±67%).
Fig 2 is a graphical image of the electrical resistivity results from numerous well-respected experimenters on copper, and the variation achieved is more than twice that between the documented and calculated values.
Given that even greater variability can be found in numerous documents and websites, it becomes very evident that great care must be taken when relying on values based upon experimentation, and even greater care with values extracted from generally available documentation (especially website sources).

Tungsten
The following tungsten filament dimensions were extracted from a General Electric brochure by Dr. Lawrence Woolf⁽⁴⁾, which equates to an operational electrical resisitivity for tungsten @ 2890K of 7.9E-07 Ω.m:
| Specified Power (W) | Diameter (m) | Length (m) | ℓ/A (/m) | Resistance (J.s/C²) | Resistivity (J.s.m/C²) | Calculated Power (J/s) |
|---|---|---|---|---|---|---|
| 25 | 3.00E-05 | 0.56 | 7.92E+08 | 576 | 7.27E-07 | 27.25 |
| 40 | 3.30E-05 | 0.38 | 4.44E+08 | 360 | 8.10E-07 | 32.97 |
| 60 | 4.60E-05 | 0.53 | 3.19E+08 | 240 | 7.53E-07 | 64.06 |
| 75 | 5.30E-05 | 0.55 | 2.49E+08 | 192 | 7.70E-07 | 85.04 |
| 100 | 6.40E-05 | 0.58 | 1.80E+08 | 144 | 7.99E-07 | 124 |
| 200 | 1.02E-04 | 0.72 | 8.81E+07 | 72 | 8.17E-07 | 314.97 |
| GE Filament Dimensions & Calculated Resisitivity 120 Volts and operating temperature (≈2900K) Calculation Method: current: I = P/V; resistance: R = V/I; resistivity: ρ = R.A/ℓ | ||||||
It is evident in the above Table that GEC's own resistivity values, which are based upon the physical dimensions of the filament, indicate different material alloys making their mathematical predictions unreliable. If the alloys were identical, so should their resistivity values, but ...
… 40W filament: resistivity is high and calculated power is low,
… 200W filament: resistivity is high but calculated power is high.
Note: the calculated power rating is not based upon electrical resistivity, but actual atomic power, and should therefore be accurate.
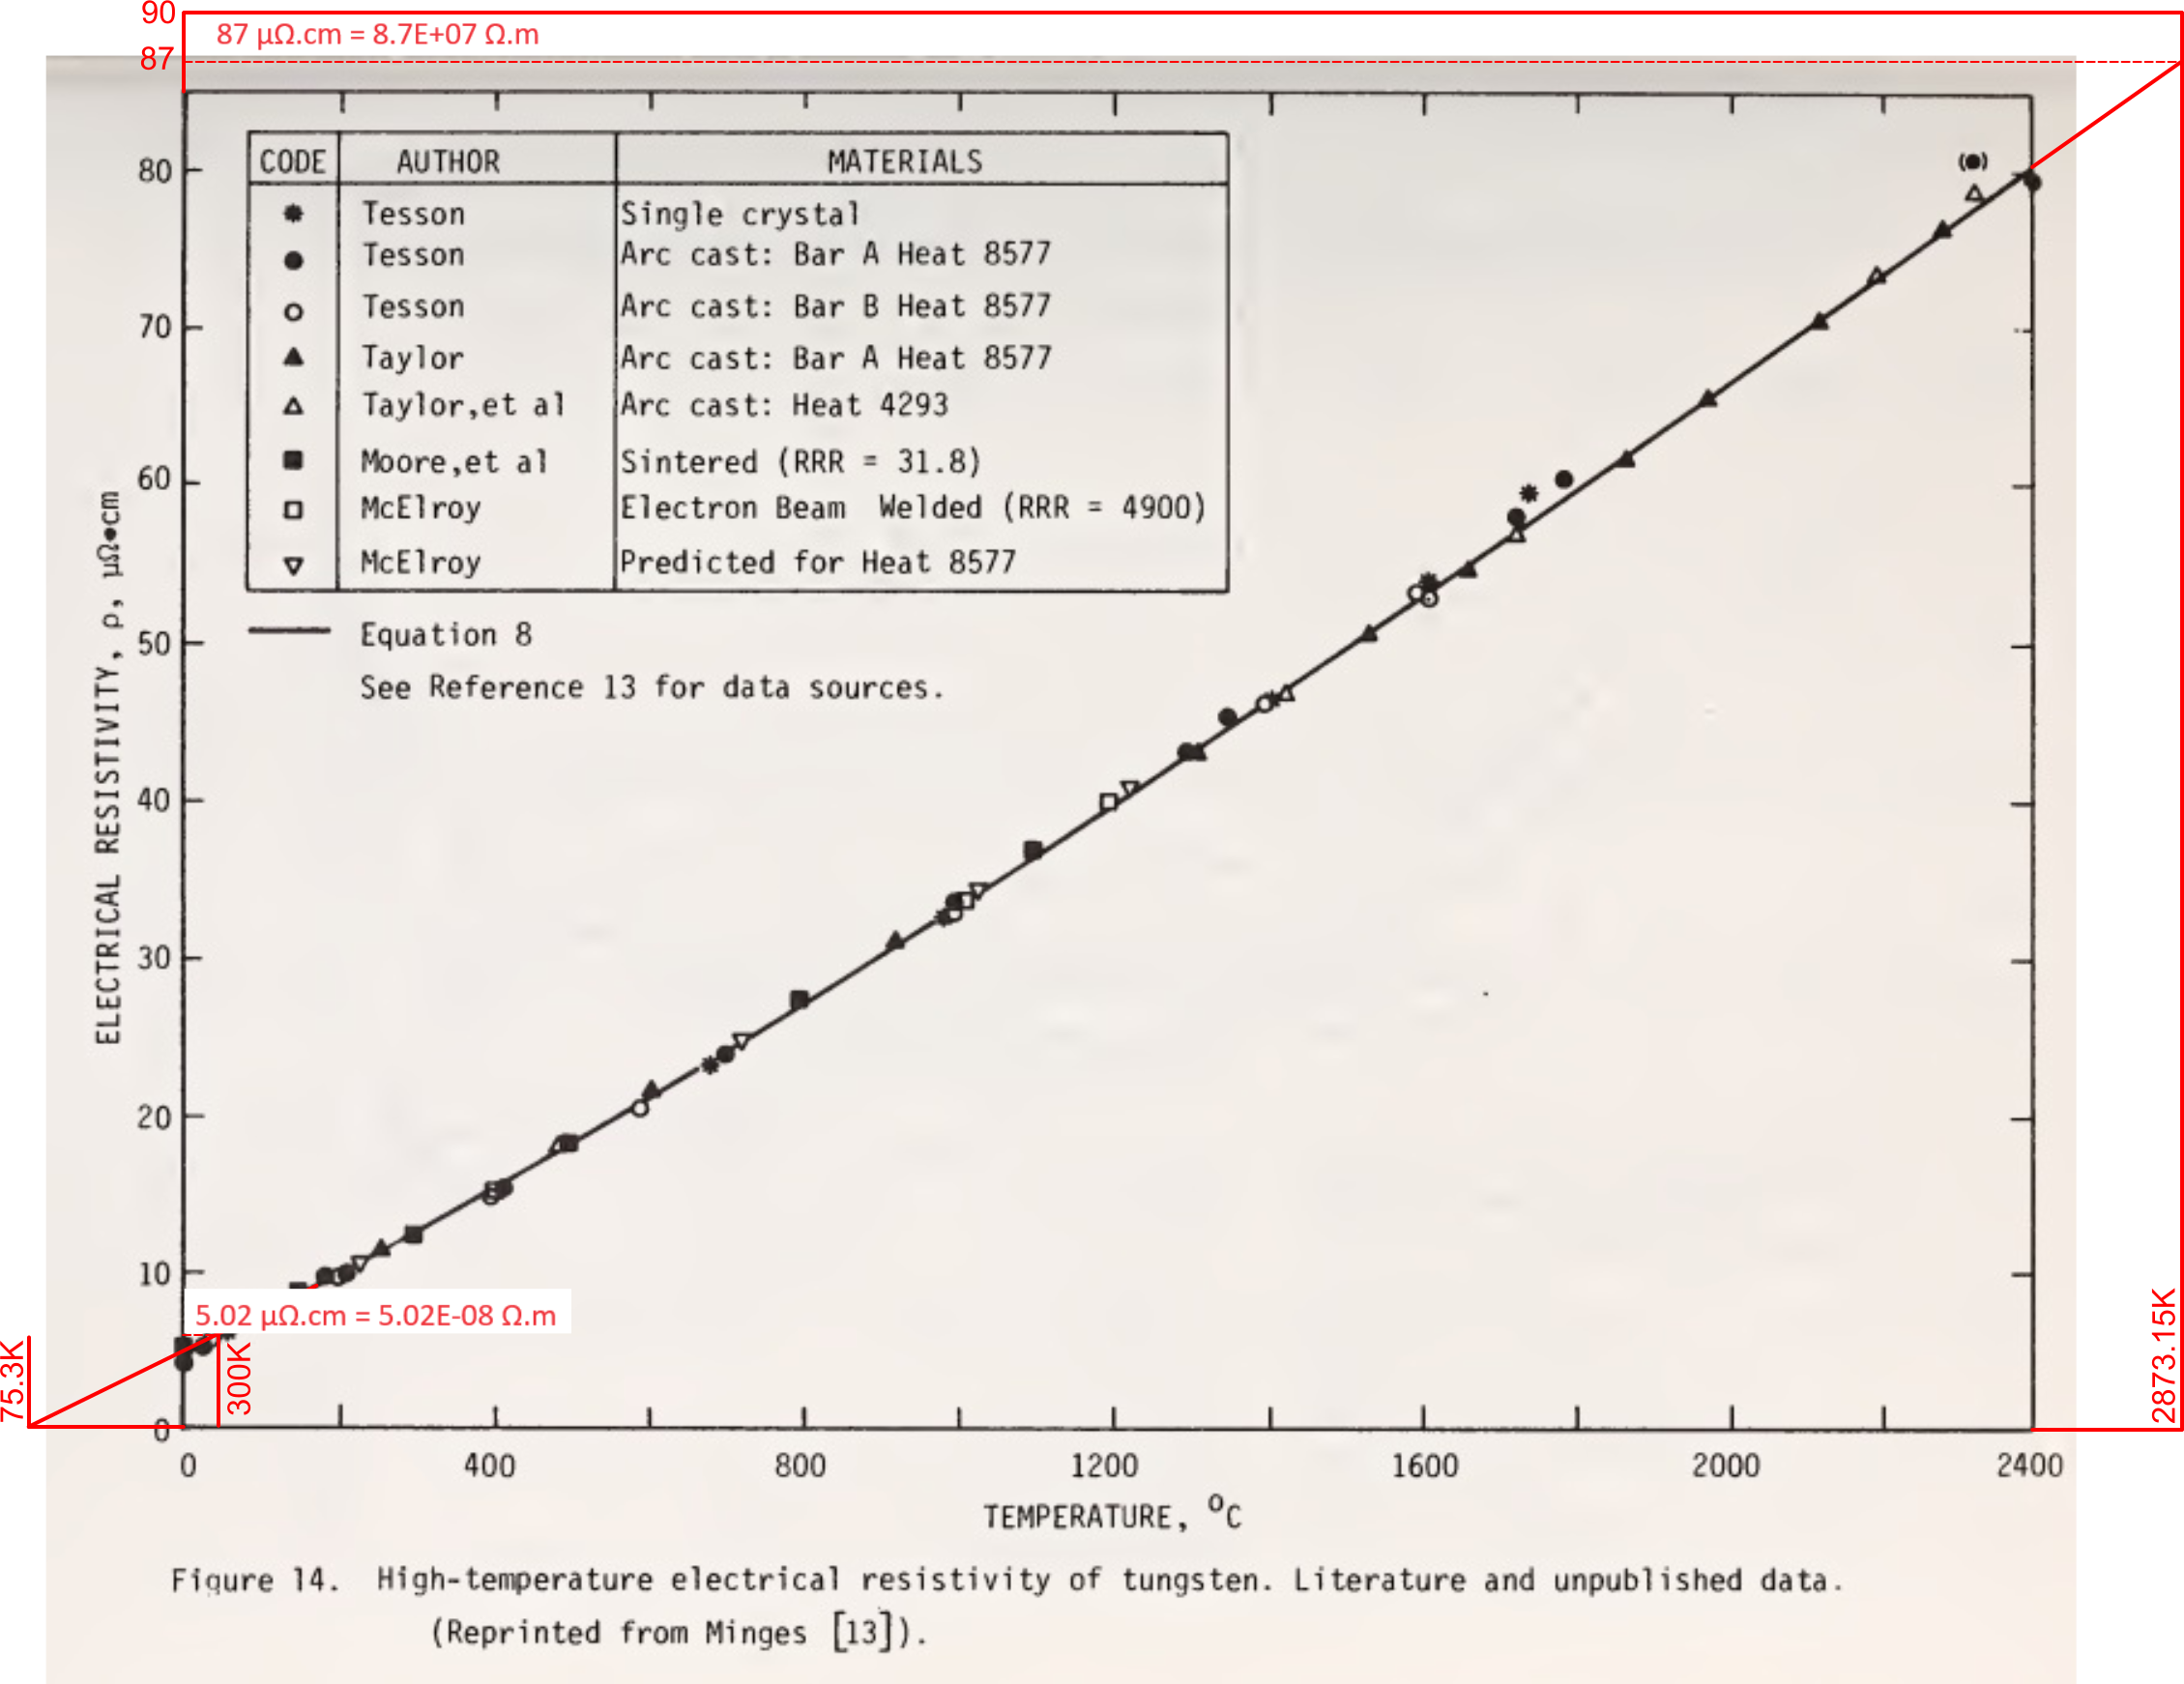
However, Fig 3 is a compilation of various values for the resistivity of tungsten from the National Bureau of Standards⁽⁵⁾;

which shows the resistivity of tungsten at 2873K of 8.7E-07 Ω.m, and 5.02E-08 Ω.m at 300K.
It is well known that the electrical resistivity of all elemental matter varies with temperature according to a linear coefficient, which is due to the coefficient of linear expansion (atomic separation) with temperature.
It must be concluded, therefore, that the non-linear variation evident in the above graph must be due to structural changes in the elemental matter as temperature rises. Whilst all but the single crystalline test-piece are sintered and/or cast, which may well be unreliable at high-temperature, that the crystalline test-piece also gives a resistivity of 8.7E-07 Ω.m, it would appear that tungsten undergoes a significant non-linear structural change at high-temperature, making mathematical prediction of tungsten unreliable at such high temperatures.
The mathematical prediction for a stable (unchanging) tungsten atom @ 2873.15K should be much closer to ≈6.6E-07 Ω.m, and is therefore the reason why the calculated power-rating (see above Table) is higher than the expected (or specified) power rating for all but one of GEC's filaments.
Refer to the electrical atom for the mathematical prediction procedure of electrical resistivity.

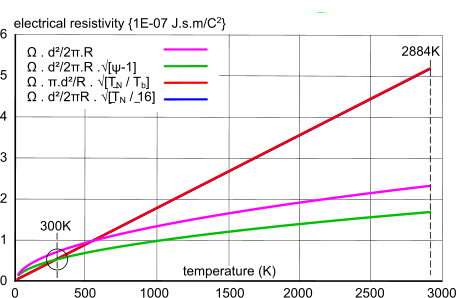
Fig 4. Resistivity vs. Temperature (tungsten)
Mathematical Prediction
Fig 4 shows a series of plots for the variation of electrical resistivity with temperature of a well-known electrical conductor; a tungsten light-bulb filament, the operational temperature of which is ≈2884K.
It is generally understood that the theoretical relationship between temperature and electrical resistivity is a straight line; the temperature coefficient of electrical resistivity. However, whilst it should be a linear relationship, it may increase exponentially - albeit very slightly (Fig 3) - if the element (atomic spacing and lattice structure) also varies with temperature.
We also know that the fundamental formula for resistivity in an electrical conductor is ρ = Ω.A/ℓ; a value dependent upon a conductor's dimensions. However, elemental electrical resistivity is based upon its atomic dimensions; the outermost shell (the electrons transmitted in DC electricity) orbital radius (R) and the atomic spacing (d). It is this relationship that gives an element its electrical signature. Therefore, in order to define the true (theoretical) electrical resistivity and temperature coefficient of any elemental matter mathematically, we must adapt the above dimensional formula to the atom; ρ = Ω.A/ℓ → Ω . d²/2πR.
However, this basic formula; gives neither a linear relationship (Fig 4) or an accurate value for 300K and 2884K (see Table below), but it is close.
We know from various sources that the electrical resistivity of tungsten at 300K is ≈5.3725E-08 J.s.m/C², and according to the National Bureau of Standards, and a linear relationship with temperature, its resistivity at ≈2884K is expected to be ≈6.6 J.s.m/C² (Fig 3).
| Option | Formula | 300K (error) | 2884K (error) | Relationship | Ave (300K) |
|---|---|---|---|---|---|
| (1) | Ω . d²/2πR | 7.680485E-08 (43%) | 2.381331E-07 (64%) | non-linear | 1.677 |
| (2) | Ω . d²/2π.R . √[ψ-1] | 5.345857E-08 (-0.5%) | 1.657481E-07 (75%) | non-linear | 0.6316 |
| (3) | ρ = Ω . π.d²/R . √[ṮN/Ṯg] | 5.482546E-08 (2%) | 5.270413E-07 (20%) | linear | 4.286 |
| (4) | ρ = Ω . d²/2πR . √[ṮN/16] | 5.467495E-08 (1.8%) | 5.255945E-07 (20%) | linear | 2.5583 |
| Electrical Resistivity: mathematical prediction vs documented values Documented values & Fig 3 Ave (300K) values are comparison values for the formulas across the entire (92) elemental range; ρₘ: ρd ṮN = temperature of outermost proton-electron pair = Ṯ/37 Ṯg = gas transition temperature of tungsten = 6200K ψ = neutronic ratio of tunsten = 1.484459 | |||||
The two formulas that provide the best theoretical fit at room and operating temperature for tungsten are (3) and (4). However, the calculated values are based upon perfect crystals and lattice alignment, whereas documented values are subject to experimental error.
It is reasonable to conclude, therefore, that formula (3) is a valid mathematical calculation method for the theoretical prediction of electrical resistivity in elemental matter.
The Solution
Notwithstanding the above, inter-atomic electrical resistivity must ultimately reflect the following sequence, which gives a mean error between calculated and documented values, across all 92 elements, of 1.057533241 (i.e. virtually identical).
Specific charge capacity: qₜ = kB/e = PEₙ/Y / e.Ṯₙ = 8.61735002820134E-05 = J / C.K
Electrical resistance in a proton-electron pair is calculated thus:
voltage: V = PE/e
current: I = e.ƒ
resistance: Ω = V/I = qₜ.Y.Ṯ/I {J.s/C²}
where 'PE' is the potential energy between the proton-electron pair, 'Ṯ' is its temperature and 'ƒ' is the electron's orbital frequency.
In an atom, 'Ω' applies to its outermost proton-electron pair(s); shell-N)
where N refers to the atom's outermost shell number.
And electrical resistivity between adjacent atoms is calculated thus:
ρₐ = ΩN . πd²/R
where R is orbital radius of the atom's outermost shell and d is the inter-atomic spacing.
The electrical resistivity between adjacent atomic elements, however, varies with their neutronic ratio (ψ), and is calculated thus:
ρₑ = ρₐ . (ψ-1)/Γ
where Γ is its nobility factor; 9.(ψ-1). Therefore; (ψ-1)/Γ = 1/9.
The only unknown is the last factor; '(ψ-1)/Γ', the conclusion of which is ongoing.
We must not forget, however, that as is evident in the Table at the top of this page and Fig 2, comparison with documented values is - at best - precarious, due to their unreliability.
Notes
- unreliable data, as stated values at 273K are greater than (or equal to) others quoted at 293K
- comment 'unreliable' is applied to elements the values of which are too variable (according to CalQlata)
- National Institute of Standards and Technology; Centre for Information and Numerical Data Analysis and Synthesis; Purdue University, West Lafayette, Indiana 47906; R. A. Matula; Electrical Resistivity of Copper
- Seeing the Light: The Physics and Materials Science of the Incandescent Light Bulb; February 20, 2002; Dr. Lawrence D. Woolf, General Atomics, San Diego, CA 92121 (Larry.Woolf@gat.com)
- National Bureau of Standards Library (260-52) (US Department of commerce); Thermal Conductivity and Electrical Resistivity Standard Reference Materials: Tungsten SRM's 730 and 799 (from 4K 3000K); Page 23; Figure 14