Wind and Waves (energies and velocities)
There are two primary causes of ocean waves; seismic events and wind:

Fig 1. Wave Motions
1) Seismic events refer to; land slip, periodic movement in the earth's crust, earthquakes, etc. This wave is generated by a substantial sudden change in the locally available volumetric water carrying capacity in the seabed, causing the excess water to rise above its natural level whilst travelling away from the event. This type of event usually results in solitary waves, that will possess greater symmetry than a wind-driven wave, and will most likely be longer and flatter over deep, expansive ocean. It will only appear as a conventional wave as it approaches land through shallow water.
2) In the case of wind, the kinetic energy in the atmospheric molecules pulls the surface water molecules along with them. They are able to do this because of the magnetic field generated by all proton-electron pairs; this process in water is called ‘hydrodynamic drag’. Whilst this form of drag (wind driven) does not have the capacity to lift water above its natural level, small localised gusts will cause ripples to occur on the water surface.
The more intense the wind velocity, the greater its kinetic energy and the more water will be pushed up the back-face of the ripples, increasing their height, ripples becoming waves as wind energy increases. Continuous wind will generate a train of following waves, each of which will possess the same potential energy generated by the kinetic energy in the wind per wave length (Fig 2).
Mathematical Models
Throughout history, mathematicians have generated models that describe a particular type of wave, but none of them predict reality; they are 'best-fit' models.
For example:
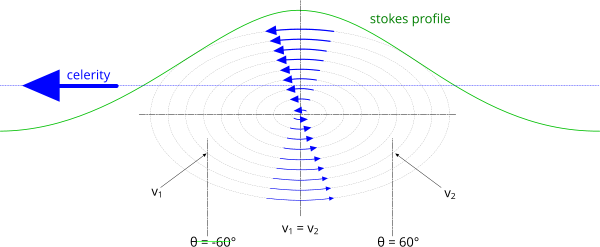
Whilst each mathematical model was generated to predict a specific wave profile; they are all based upon elliptical water particle flow patterns. But if we apply an ellipse to any mathematical wave-shape, it doesn't matter how you alter the size and shape of the ellipse, you cannot make it fit (Fig 1).
They all predict symmetrical properties (front and back), which cannot be the case in reality, because different loading conditions apply to the front and back of a wave (Figs 1 & 2).
The greatest wind influence is at the air-water interface, but this energy transfer is being sapped by hydrodynamic drag, reducing water particle velocities. So, the velocity in all water particles around an ellipse must be slowing down. Which means that, contrary to theory, water velocities could not be identical either side of the elliptical axes.

Water Particle Velocities
Put a zodiac on the surface of a fast-flowing river (current) and it will travel almost as fast as the water itself. But, put it on the surface of a rough sea, and it will simply bob up and down as the waves pass beneath it. This is how we know that water particles do not travel with the wave.
The highest calculated velocities within a wave are significantly less (e.g. ¹/₂₀ᵗʰ) than that of the wave itself (celerity).
What’s actually happening, is; each water particle impacts its neighbour in the direction of travel, transferring its kinetic energy. But, the water particles themselves, move very little, they remain almost in the same place. The calculated motions (vx, vz, ax, az) actually refer to the speed with which kinetic energy transfer occurs between water particles.
According to the conservation of energy, the kinetic energy in each wave must be identical to the kinetic energy in the air between peaks (Fig 2). And the potential energy in the wave - above mean water-level - must be the inverse of this kinetic energy. In other words, as the wind velocity varies, so too does the mass of water lifted; altering its height.
Because of the conservation of energy, wind-driven waves will have a limiting mass and therefore the reason for wave-trains, each wave of which comprises a limiting cross-section whereby kinetic and potential energies balance.
Calculations

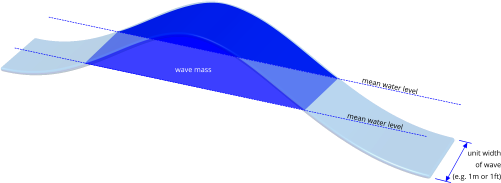
Fig 3. Unit Width of a Wave
Despite the problems with mathematical models, their calculated profiles are sufficient to give us an idea as to the relative water and air masses in a given wave profile (Fig 2), which can help us establish the approximate wind velocity required to generate it.
Centre of Mass
First we calculate its profile co-ordinates (Waves: menu item; 'Data>Plot Co-ordinates'), which can be inserted into a spreadsheet.
divide the profile into strips over an entire wave-length; w = L/360 (Fig 4)
mass of each strip; m' = η.w.ρ {kg per unit width; Fig 3}
moment of each strip; md' = m' . ½.η {kg.m per unit width}
Now we calculate the centre of wave mass above mean water level; if η>0:
total mass; m = Σm'
total moment; md = Σmd'
centre of mass; d = md/m (Fig 5)

Water Particle Kinetic Energy
calculate vₓ₁ & vₓ₂ when η=d (θ₁) and when θ₂=0 (Fig 5)
vₓ = ½.(vₓ₁ + vₓ₂) {m/s}
total water particle kinetic energy: KE = ½.m.vₓ² {J}
Wind Speed
Next we calculate the wind speed:
cross section area of the air in each strip; A' = w.(½.H - η) {m²} (Fig 4)
total cross section area of the air between peaks; : A = ΣA' {m²}
mass of air between peaks: mₐ = A.ρₐ {kg} {per unit width; Fig 3}
velocity of the air: v = √[2.KE/mₐ] {m/s}
Wave Celerity
Next we calculate the celerity of the wave:
Think of a wave as a torque driven wheel (Fig 5).
The kinetic energy in the water particles are rotating the wheel.
energy moment = momentum x constant of motion; Ed = p.h {kg.m/s . m²/s = kg.m²/s² . m = J.m}
momentum = mass x velocity; p = m.v {kg.m/s}
constant of motion = radius x velocity; h = R.v {m²/s}
Ed = m.v . R.v = m.R.v² {J.m}
the wheel:
wheel mass; mw = 2.m {kg}
driving torque; T = mw.g.R {J}
distance travelled by centre of mass; a = 2πd {m}
energy moment; Ed = T.a = mw.g.R . 2πd {kg.m²/s² . m = J.m}

Now calculate the linear velocity of the wave (celerity):
linear energy moment; Ed = momentum (mw.v) x constant of motion (d.v) {kg.m/s . m.m/s = J.m}
Ed = mw.d.v² {J.m}
celerity (c); v = √[Ed / m.d] {√[kg.m³/s² / kg / m] = m/s}
Example Calculations (Waves)
| Property | Linear Theory | Stokes V Theory | Units |
|---|---|---|---|
| Input Data: | |||
| mean water depth wave height from trough to peak wave period from trough to trough (estimate) height of centre of mass angle through the wave current velocity gravitational acceleration |
600 10 15 1.963545 66.87682 0 9.806631 |
200 10 15 2.121336 62.93098 0 9.806631 |
m m m ° m/s m/s² |
| Output Data: | |||
| length of wave from peak to peak time through the wave (to θ) distance through the wave (to θ) wave number wave angular velocity wave celerity (speed) wave profile (at θ) horizontal velocity (at θ,z) vertical velocity (at θ,z) horizontal acceleration (at θ,z) vertical acceleration (at θ,z) wave slope (at θ,z) |
351.1741 2.786534 65.23724 0.017892 0.418879 23.41161 # 1.963546 0.851897 1.995008 0.835667 -0.356842 -4.703288 |
353.3922 2.622124 61.77588 0.01778 0.418879 23.55948 ## 2.121336 0.981813 1.923278 0.807518 -0.409881 -4.869107 |
m s m ᶜ/s m/s m m/s m/s m/s² m/s² ° |
| Wind and Wave: | |||
| total water particle kinetic energy wind speed energy moment Ed celerity (c) celerity kinetic energy (KE = 2π.Ed/L) wave potential energy (PE = m.g.d) |
653609.5333 23.93 | 53.53 | 86.15 693100297 24.82274809 # 12400907.7 11031033.83 |
701198.8645 24.79 | 55.454 | 89.245 813992744.5 26.01266484 ## 14472496.15 11796975.97 |
J m/s | mph | km/h J.m m/s J J |
| Wave performance due to wind | |||
KE and PE (above) should be equal for each respective theory, but whilst close, they're incorrect.
To equalise these energies, the following wave lengths would apply;
Linear wave theory; L = 394.784178 m, which means that the actual wave period for a 10m linear wave should be closer to 16 seconds, rather than the 15 seconds applied above.
Stokes V theory; L = 433.5405332 m, which means that the actual wave period for a 10m Stokes V wave should be closer to 16.7 seconds, rather than the 15 seconds applied above.
This iterative approach allows you to get very close to reality - in terms of wave profile and wave energies - whilst applying approximate mathematical models.
Further Reading
You will find further reading on this subject in reference publications(6, 8 & 9)